Insights
June 2022
Measuring Performance in Event Time

Global Markets researchers measure investment returns based on the passage of meaningful events rather than just counting the days.
From a calendar perspective, every day or month is the same as any other day or month.However, from an event perspective, some periods are more meaningful than others.For example, we arguably experienced more in the COVID-induced upheaval of March 2020 than we do in most years. For investors, meaningful events are important, because they may cause asset prices to change. Based on this intuition, we explore the implications of measuring asset performance over periods with equal event intensity, a new clock that we call event time. Compared to traditional calendar returns, we find that event returns are better behaved in two key ways: (1) individual asset returns more closely resemble normal distributions and (2) co-movements between asset returns are more stable. These enhanced properties can help investors improve stress testing, performance evaluation, portfolio construction, and more.
Key highlights
Markets move at the pace of information. So why do we analyze them based on the Earth’s rotation or the time it takes to orbit the sun? Calendar time intervals are standardized, but they are not comparable: there are entire years less eventful than a single month during the Covid-induced upheaval of 2020. Perhaps it is better to create time series for investments that are based on the passage of meaningful events rather than merely counting the days.

Imagine stretching and compressing a timeline into units with equal event intensity. During calm periods, it may take a month to clock one event.
During unusual periods, it may take just a day. Our new clock measures what we call event time. It is based on information theory, which says that unusual events are informative. For investors, informative events are important, because they may cause asset prices to change. With this in mind, we explore the implications of measuring asset class returns in event time rather than calendar time.
Our first challenge is how to define event intensity. It would be intuitive to monitor the news and record events accordingly, but this would be laborious and subjective. Instead, we use a handy statistic called the Mahalanobis distance to quantify daily unusualness, or event intensity, based on the returns of 11 U.S. equity sectors. Then, we start and stop our event clock when event intensity, accumulated over consecutive days, reaches a chosen threshold. With our event clock we measure a new return sample, and we compare the statistical properties of these asset returns to the traditional calendar method.
Compared to calendar returns, we find that event returns are better behaved in two key ways: (1) individual asset returns much more closely resemble normal distributions, and (2) co-movements between asset returns are more stable. Investors can benefit from these enhanced properties in many ways
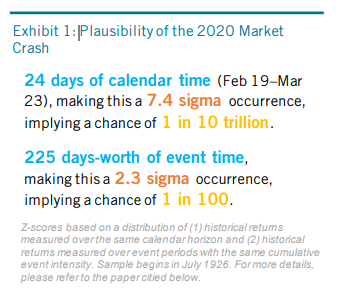
- Stress testing: The likelihood of market crashes is more realistic when measured in event time. For example, the calendar-based likelihood of the 2020 Covid crash was 1 in 10 trillion. According to event time, it was about 1 in 100 (see exhibit).
- Performance evaluation: To receive the same level of information in each measured return, investors should evaluate external managers and strategies based on a common degree of event intensity rather than elapsed time.
- Portfolio construction: Portfolios formed from volatilities and correlations measured in event time may prove more resilient to shocks that unfold over a variety of timescales.


